ArcSight is a SIEM system that collects information about events (logs) from network devices which it is configured on in a corporate network. Its purpose is to monitor the system environment from the perspective of information security — that is, to identify events suspected as being cyber attacks or information security vulnerabilities.
The infrastructure of the system consists of a server that contains a database in which all of the information is concentrated, and connectors (agents) that transfer the information from the end components of the network to the server. There are a number of client programs that constitute the interfaces which analysts can use to manage and monitor ArcSight. The two main interfaces are:
- The Console
- ArcSight Command Center — web based, accessed through a browser on port 8443
In the following text, I will focus on the console.
The Console
The console is a software component that we interact with and which serves as the client program. The console displays the events that flow to it through active channels. These active channels are filtered by filters, for the purpose of displaying the specific information chosen to be displayed on each channel.
How to Use the Console
It is important to understand that the console is divided into three main panels/menus: the navigation panel, the display panel, and the editing panel. There is a toolbar at the top of the window with different icons, each with a different functionality — most of them show different details/views of different pieces of information that flow into the system.
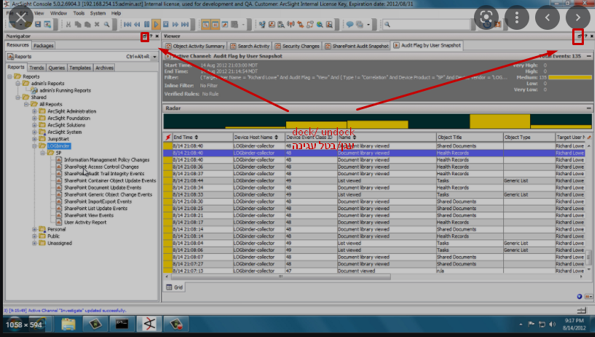
There are three specific buttons that display or remove each of the three main menus from the screen. Each of the console's main menus can also be "undocked" — displayed on a full screen in its own independent window. This is done by clicking the docking button located on the upper right corner of the menu (next to the X icon). Pressing the same button again will dock the menu back to the combined display.
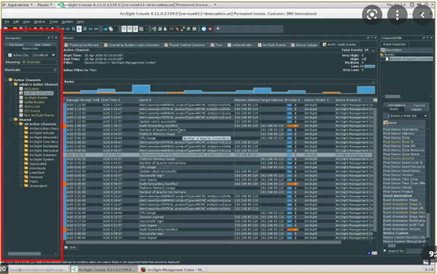
The Navigation Panel
The navigation panel looks like the Windows File Explorer: a classic menu of folders and subfolders in a tree structure, expandable by clicking on the main folder. It shows a breakdown of the resources available on the system — active channels, filters, rules, predefined fields for channels, and everything else on the system.
You can customize and create new resources in any desired category. Near the top of the navigation menu there is a drop-down menu which opens to display all the categories of resources that can be selected. Usually, each category will show a tree structure with a public folder and personal folders for different users. Access to resources is defined on a per-user basis — as long as resources do not exist in the public folders, one user will not be able to see resources created by another user.
Filters
Restrictions on the retrieval and display of information according to specific requirements. They are defined by Boolean operators (AND, OR, NOT, etc.). The filters themselves are not activated until they are attached to another resource, such as a rule or an active channel — only then do they take on practical meaning.
Active Channels
These are important primary resources that open in the viewer panel to display a concise image of the selected information from the database on a timeline (the more upper a row is, the newer). They use filters to retrieve and display only the information that the filter had been set to filter. Each event is represented by a line divided into fields/columns — the fields are defined by users to concisely display selected information about the events.
To open an active channel for display, select it from the list of 'active channels' on the navigator panel and double-click on it. If there is already an active channel open, the additional channel will be added on a separate tab. Both channels will remain active simultaneously, each filtering and displaying the information it was configured for.
- There are different fieldsets (compositions of fields) for displaying different concise information on the rows of the active channel. While filters are tools that filter events from the database, fieldsets are designed to further filter the information displayed to a summary for each event on the viewer panel. It is also possible to customize new fieldsets.
- You can add columns and fields to the active channel directly by right-clicking on the existing column headers and selecting 'columns.' Note that the resulting fieldset will be temporary — if you close the active channel without saving it, the changes will be lost.
Rules
Rules are designed to define actions that will be performed in response to certain conditions detected in the events filtered to an active channel. The rule consists of conditions for an action and the action itself — the conditions are defined by filters.
Rules, similarly to filters, are not activated by themselves until they are attached to an active channel. Unlike filters (which are attached to a channel through direct editing of the channel settings in the inspect/edit panel), rules cannot be attached to active channels this way. To attach a rule to an active channel:
- Open/select the active channel on the viewer panel so it is on active display.
- In the navigator panel, click and hold on the rule you want to apply.
- Drag it to the Real Time Rules folder at the bottom of the navigator panel. This folder represents all rules attached to the currently displayed active channel.
When you click 'new rule' in the navigator menu, the following rule types appear:
- Standard rule — the most sophisticated rule in terms of the range of actions it can perform in response to a detected condition. Actions include creating an active list, running a single command, running a script, sending an alert, and more.
- Lightweight rule — actions are limited only to creating active lists, such as a session list. It filters and extracts less information, putting less load on the system.
- Pre-persistence rule — actions are limited only to populating new information about the triggered events within its fields. The information can be added as a new field on a certain active channel.
Dashboards
As expected, these are resources that graphically present the different information available on the system (here too, information must be filtered by assigning filters to the various dashboards). ArcSight's dashboards are more than graphical representations of data — they can also be subjects of manipulations and mathematical calculations of their displayed data to generate new data for graphical representation.
Like other resources, the user can define a new dashboard consisting of various charts and diagrams, each with its own filter. Display options include pies, tables, graphs, etc. While information can be viewed in active channels, it can alternatively be viewed through dashboards — another presentation of the same information.
Foundation Resources
There are predefined resources that come with the system, built by ArcSight developers to facilitate its effective use. For example, there are pre-designed rules and filters to identify brute-force events according to criteria that the developers deemed appropriate. These resources are usually sorted within folders called 'foundation'.
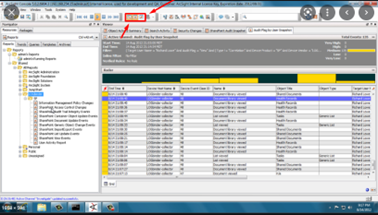
The Display Panel (Viewer)
This panel shows the information that flows into the system, displayed in a concise instance defined by us — the active channel. To expand and get more details about an event, double-click on the row representing the event, after which a detailed view will open in the inspect menu.
There is a color code wherein each color represents a level of severity of the event. For example, a line highlighted in blue represents a low-severity event.
There are classic media flow buttons designed to move forward and backwards when displaying events according to the time they were received. For example, you can pause the flow of information temporarily with the "Pause" button, continue with "Play", or display events received at an earlier time with the "rewind" button. Note that when clicking 'rewind' or scrolling down a lot, you are pulling old information from the database — this can consume a lot of resources. Likewise, if an active channel is set to display events from too wide a time range, the information retrieved at regular intervals from the database can be massive and cause significant performance slowdown.
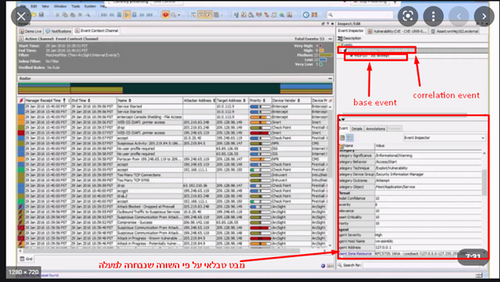
Event Types
- Compliance event — a type of event that represents an activity which violates/conforms to the requirements of a rule defined by an ArcSight user (not pre-built). These are additional events for the channel's display, occurring when conditions of all rules transferred to the 'real time rules' folder are met.
- Base event — an event that originates from the logs of the various components that ArcSight monitors. The logs are pre-programmed to collect these events (no rule had been defined on the ArcSight system by the user).
- System event — records that the ArcSight system creates by itself to document its current activity and use.
The Inspect/Edit Panel
This is the "micro" menu, designed to go deeper and display all the details of its pertaining event or resource. It can also be used to edit different resources depending on what had been opened. Basically, it is a menu that contains different tabs with different options according to each object.
Events
When the opened tab deals with an existing event retrieved from the database, this menu displays a more in-depth picture of that event. While the active channel presents information in "bullet-heads" according to predefined fieldsets, the inspect menu will display all of the information about an event in a tabular form.
Sometimes it will also display additional events related to the displayed event. For example, if the event was created by the activation of a correlation rule, the inspect menu will also display the base event where the conditions which caused the rule's activation had been met. In the same tab, it will be possible to move from the correlation event row to the rows of each of the base events to see their specific information.
Resources
To open a tab for editing a resource (filter, rule, etc.), select the desired resource in the navigator panel and right-click on it. In the newly opened menu, select "edit <resource>". A new tab will open in the inspect/edit panel with all of the relevant editing options.
To create a new resource, click on the relevant resource folder in the navigator and right-click. In the menu that opens, select "new <resource>" and a tab will open with all of the relevant settings for its creation — essentially an empty form with no presets.
How to Create Filters
Perhaps the most important resource to learn how to set up is the filter, because it is a basic resource from which other resources are created. Without filters it is impossible to create rules or active channels.
To create a new filter: select the resource tab in the navigation panel, click on the top row to open the category drop-down menu, and enter the "Filters" category. Right-click on the desired folder and select "create new". A new window will open in the display panel with several tabs:
- Attributes tab — defines relatively superficial characteristics of the filter, such as its name and how it will be displayed in the system.
- Filter tab — the main tab that actually defines the requirements for the filter to do its job. This tab determines the essence of the filter.
Filter Conditions
A condition is the basic building block of the filter, and one filter can include multiple conditions. Each condition is built from three parts:
- The condition field (key) — comes predefined in ArcSight's conditions library.
- A logical operator (AND, NOT, Contains, Starts with, Ends with, etc.)
- The value — which should make sense and match the field.
All three elements must be present for a condition to be valid. Example of a condition:
Device vendor = MicrosoftIn this example, 'Device vendor' is the key/empty field selected from ArcSight's library, = is the operator, and 'Microsoft' is the value typed in a free text field. Note that if the entered value is not already listed on the ArcSight system as a monitored product, no event will be filtered — the condition will be useless — because ArcSight has distinct methods for finding each of its recognized products' events.
Boolean Operators Between Conditions
The relations between multiple conditions in a filter are defined by three logical operators:
- AND — requires the filtered events to meet all of the listed conditions defined under it.
- OR — causes the filter to display all events that meet at least one of the listed conditions.
- NOT — excludes events that meet the specified condition.
It is also possible to create combinations of different operators with a list of conditions, and the filter will apply Boolean logic accordingly — just like an if statement in a programming language.
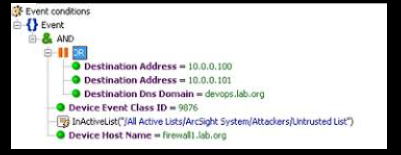
In the image above you can see an example of the filter tab with a defined list of conditions, in addition to the operators that define the relationships between them. Note the tree structure: all conditions are subject to the AND operator (meaning all must be met), but the first condition contains three sub-conditions under the OR operator (meaning only one of the three needs to be met for the first condition to be satisfied).
To apply a filter to a channel, associate it with that channel by selecting it on the channel's filter settings in its display panel.
Inline Filters
There is a quick alternate way to create a filter without using the display/edit panel. By opening the inline filter field in the viewer (found above the table displaying all event lines), you can add filters that had not been defined or assigned in advance to the active channel.
When you confirm the addition of the inline filter, the channel will automatically split into two channels: one will remain with only the original filter, and the other will also include the newly added inline filter.
Warning: neither the new channel nor its new filter will be saved once the channel is closed.
 ← Back to Articles